Clustering

Overview

Clustering is a type of unsupervised learning that involves grouping a set of data points such that objects in the same group (called a cluster) are more similar to each other than to those in other groups (clusters). The goal is to discover intrinsic groupings in the data, without any prior labels.

Key concepts in clustering include:

  • Similarity/Distance Measure: A function that quantifies the likeness or dissimilarity between two data points (e.g., Euclidean distance, cosine similarity).
  • Centroid: The center point of a cluster, often calculated as the mean of all data points in that cluster (especially in centroid-based clustering like K-Means).
  • Intra-cluster distance: The distance between data points within the same cluster. Good clustering minimizes this.
  • Inter-cluster distance: The distance between different clusters. Good clustering maximizes this.

Common clustering algorithms include K-Means, Hierarchical Clustering, DBSCAN, and Gaussian Mixture Models.

Core Concepts

  • Types of Clustering Algorithms

    Different clustering algorithms have different approaches to grouping data:

    • Centroid-based (e.g., K-Means):
      • Represents clusters by a central vector
      • Good for well-separated, spherical clusters
      • Sensitive to outliers
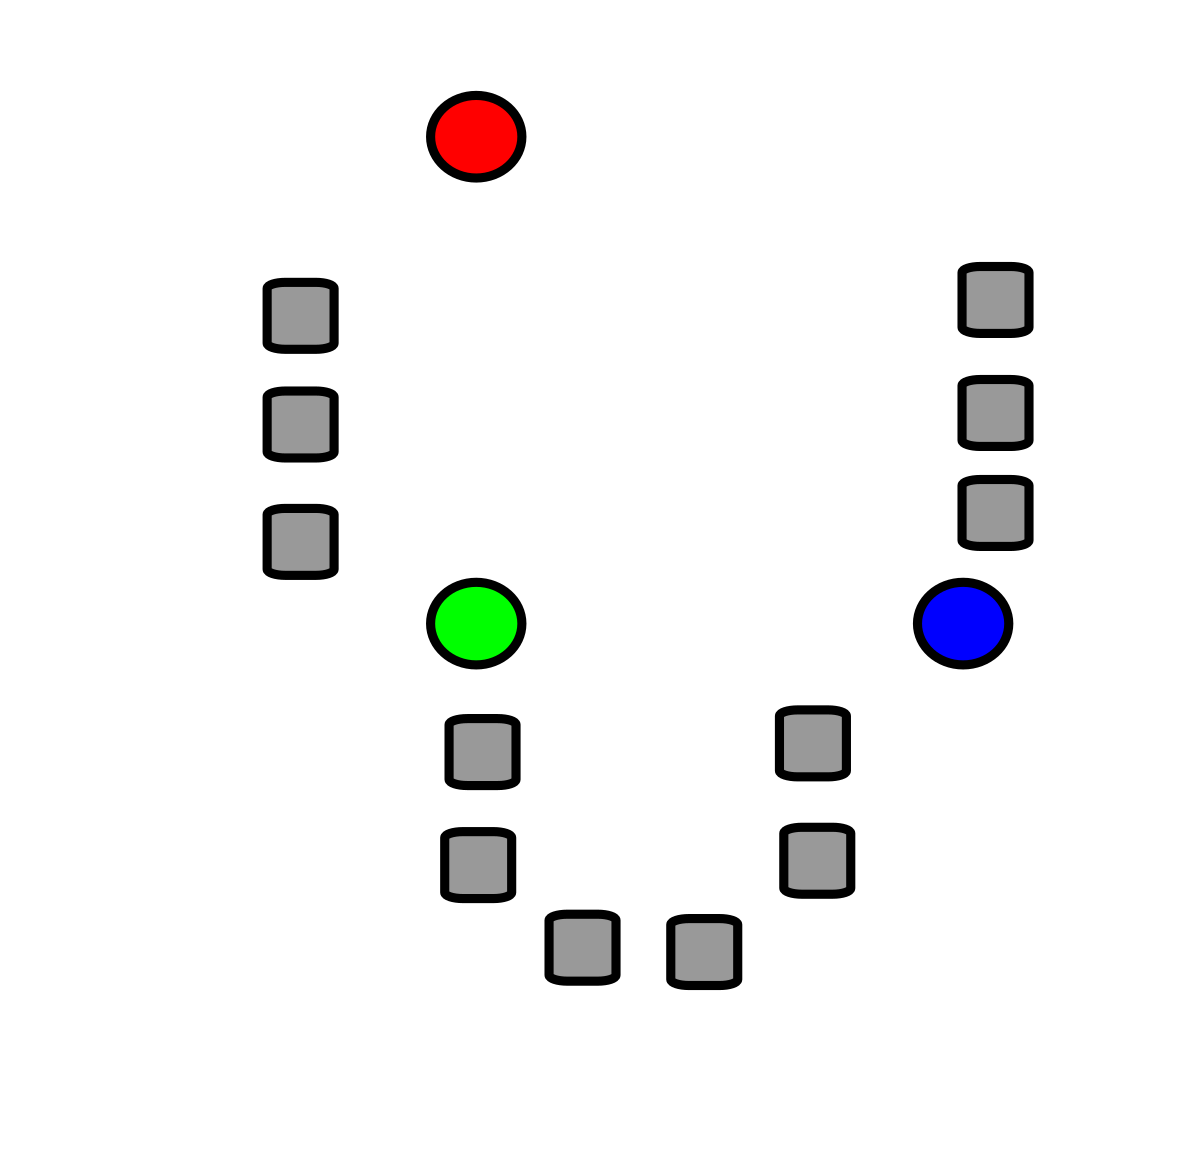
      K-Means Clustering

      K-Means Clustering: Iterative process of assigning points to nearest centroids and updating centroids

    • Density-based (e.g., DBSCAN):
      • Defines clusters as dense regions in space
      • Can find arbitrarily shaped clusters
      • Handles noise and outliers well
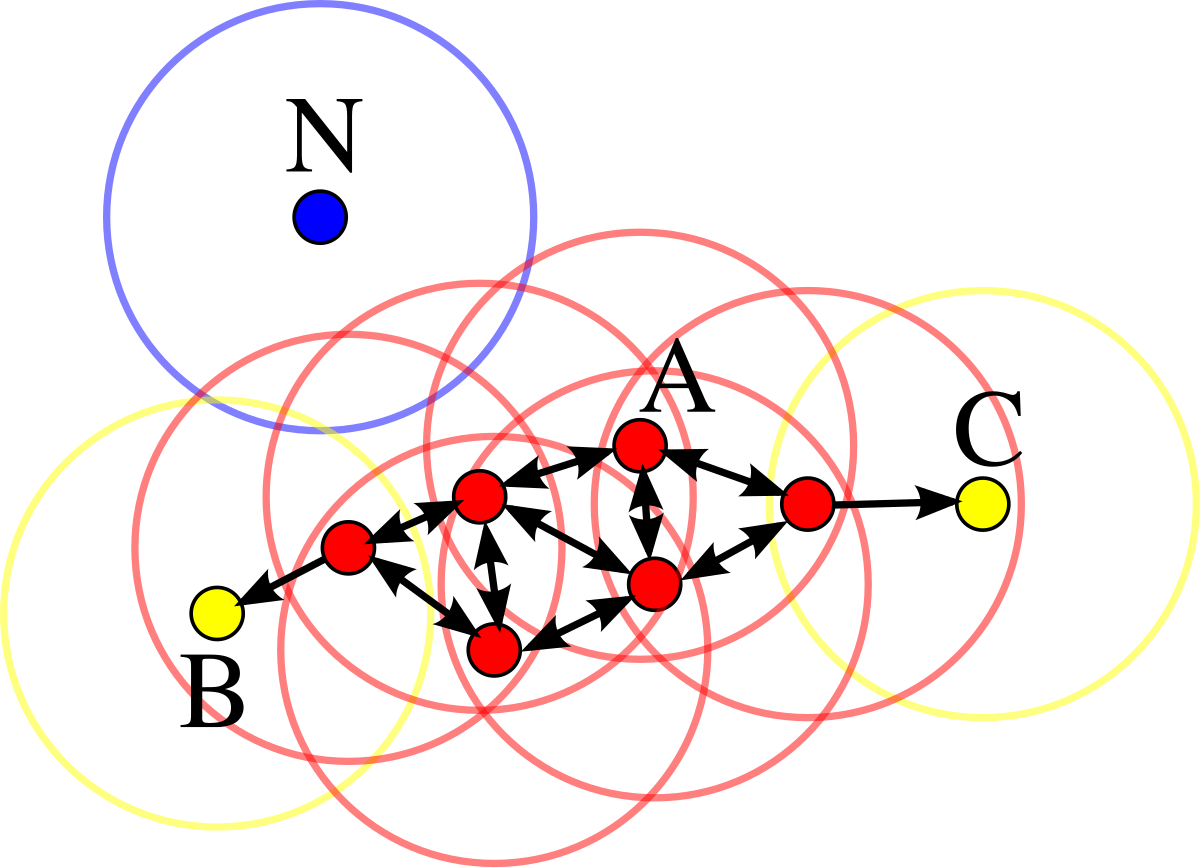
      DBSCAN Clustering

      DBSCAN: Density-based clustering showing core points, border points, and noise points

    • Hierarchical (e.g., Agglomerative):
      • Creates a tree of clusters
      • Provides multiple levels of granularity
      • No need to specify number of clusters
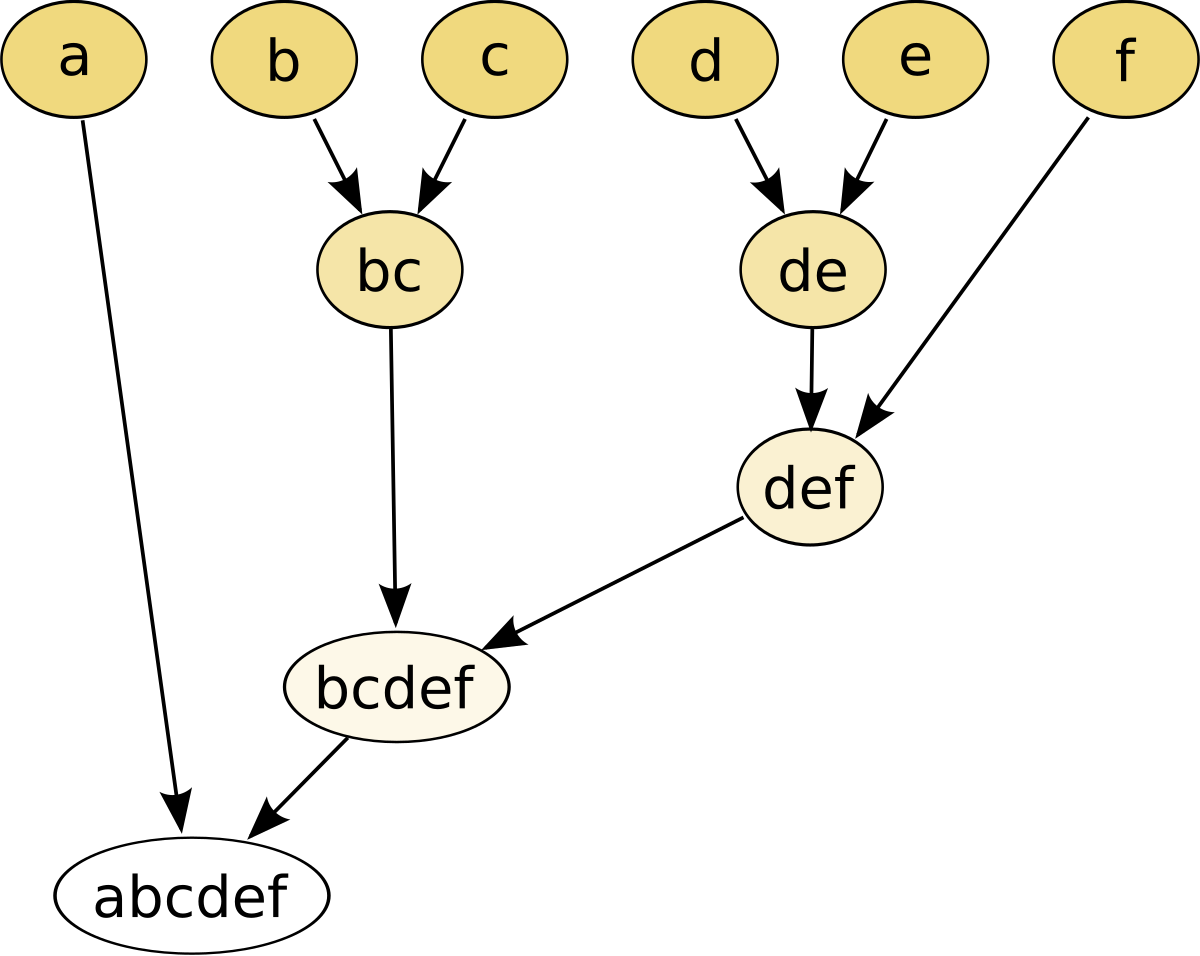
      Hierarchical Clustering

      Hierarchical Clustering: Dendrogram showing the tree-like structure of clusters

    • Distribution-based (e.g., Gaussian Mixture):
      • Models clusters using probability distributions
      • Provides soft cluster assignments
      • Can capture complex cluster shapes
  • Distance Metrics

    Common distance metrics used in clustering:

    • Euclidean Distance:
      • Most common metric
      • $d(p,q) = \sqrt{\sum_{i=1}^n (p_i - q_i)^2}$
      • Good for continuous data
    • Manhattan Distance:
      • Sum of absolute differences
      • $d(p,q) = \sum_{i=1}^n |p_i - q_i|$
      • Less sensitive to outliers
    • Cosine Similarity:
      • Measures angle between vectors
      • $\cos(\theta) = \frac{p \cdot q}{||p|| ||q||}$
      • Good for high-dimensional data
  • Algorithm Selection

    Guidelines for choosing the right clustering algorithm:

    • K-Means:
      • When clusters are expected to be spherical
      • When the number of clusters is known
      • For large datasets (scalable)
    • DBSCAN:
      • When clusters have arbitrary shapes
      • When there's noise in the data
      • When the number of clusters is unknown
    • Hierarchical:
      • When hierarchical structure is important
      • For smaller datasets (computationally intensive)
      • When visualization of hierarchy is needed
    • Gaussian Mixture:
      • When soft clustering is needed
      • When clusters overlap
      • When probabilistic assignments are useful
  • Data Preprocessing

    Important preprocessing steps for clustering:

    • Feature Scaling:
      • Essential for distance-based algorithms
      • Use StandardScaler or MinMaxScaler
      • Ensures all features contribute equally
    • Dimensionality Reduction:
      • Consider PCA or t-SNE for high-dimensional data
      • Can improve clustering performance
      • Helps with visualization
    • Handling Missing Values:
      • Impute or remove missing values
      • Consider impact on distance calculations
      • Document treatment of missing values

Implementation

  • K-Means Clustering Example

    
    import numpy as np
    import pandas as pd
    from sklearn.datasets import make_blobs
    from sklearn.cluster import KMeans
    from sklearn.metrics import silhouette_score
    import matplotlib.pyplot as plt
    import seaborn as sns
    
    def kmeans_example():
        # Generate synthetic data
        n_samples = 300
        n_features = 2
        n_clusters = 4
        X, y_true = make_blobs(
            n_samples=n_samples,
            n_features=n_features,
            centers=n_clusters,
            cluster_std=0.60,
            random_state=42
        )
    
        # Initialize and fit KMeans
        kmeans = KMeans(
            n_clusters=n_clusters,
            init='k-means++',
            n_init=10,
            random_state=42
        )
        kmeans.fit(X)
    
        # Get cluster assignments
        y_pred = kmeans.predict(X)
    
        # Calculate silhouette score
        silhouette_avg = silhouette_score(X, y_pred)
        print(f"Silhouette Score: {silhouette_avg:.3f}")
    
        # Visualize results
        plt.figure(figsize=(12, 5))
    
        # Plot original data
        plt.subplot(1, 2, 1)
        plt.scatter(X[:, 0], X[:, 1], c=y_true, cmap='viridis', alpha=0.7)
        plt.title('Original Data')
        plt.xlabel('Feature 1')
        plt.ylabel('Feature 2')
    
        # Plot clustered data
        plt.subplot(1, 2, 2)
        plt.scatter(X[:, 0], X[:, 1], c=y_pred, cmap='viridis', alpha=0.7)
        centers = kmeans.cluster_centers_
        plt.scatter(centers[:, 0], centers[:, 1], c='red', marker='x', s=200, linewidths=3, label='Centroids')
        plt.title('K-Means Clustering')
        plt.xlabel('Feature 1')
        plt.ylabel('Feature 2')
        plt.legend()
    
        plt.tight_layout()
        # plt.show()
    
        # Elbow method for optimal k
        inertias = []
        silhouette_scores = []
        k_range = range(2, 11)
    
        for k in k_range:
            kmeans = KMeans(n_clusters=k, random_state=42)
            kmeans.fit(X)
            inertias.append(kmeans.inertia_)
            silhouette_scores.append(silhouette_score(X, kmeans.labels_))
    
        plt.figure(figsize=(12, 5))
    
        # Plot elbow curve
        plt.subplot(1, 2, 1)
        plt.plot(k_range, inertias, 'bo-')
        plt.xlabel('Number of Clusters (k)')
        plt.ylabel('Inertia')
        plt.title('Elbow Method')
    
        # Plot silhouette scores
        plt.subplot(1, 2, 2)
        plt.plot(k_range, silhouette_scores, 'ro-')
        plt.xlabel('Number of Clusters (k)')
        plt.ylabel('Silhouette Score')
        plt.title('Silhouette Analysis')
    
        plt.tight_layout()
        # plt.show()
  • DBSCAN Clustering Example

    
    from sklearn.cluster import DBSCAN
    from sklearn.preprocessing import StandardScaler
    from sklearn.datasets import make_moons
    
    def dbscan_example():
        # Generate non-spherical data
        X, y_true = make_moons(n_samples=200, noise=0.05, random_state=42)
    
        # Scale the data
        scaler = StandardScaler()
        X_scaled = scaler.fit_transform(X)
    
        # Initialize and fit DBSCAN
        dbscan = DBSCAN(
            eps=0.3,          # Maximum distance between two samples for one to be considered as in the neighborhood of the other
            min_samples=5,    # Number of samples in a neighborhood for a point to be considered as a core point
            metric='euclidean'
        )
        y_pred = dbscan.fit_predict(X_scaled)
    
        # Number of clusters and noise points
        n_clusters = len(set(y_pred)) - (1 if -1 in y_pred else 0)
        n_noise = list(y_pred).count(-1)
    
        print(f"Number of clusters: {n_clusters}")
        print(f"Number of noise points: {n_noise}")
    
        # Visualize results
        plt.figure(figsize=(12, 5))
    
        # Plot original data
        plt.subplot(1, 2, 1)
        plt.scatter(X[:, 0], X[:, 1], c=y_true, cmap='viridis', alpha=0.7)
        plt.title('Original Data')
        plt.xlabel('Feature 1')
        plt.ylabel('Feature 2')
    
        # Plot DBSCAN clusters
        plt.subplot(1, 2, 2)
        unique_labels = set(y_pred)
        colors = plt.cm.Spectral(np.linspace(0, 1, len(unique_labels)))
    
        for k, col in zip(unique_labels, colors):
            if k == -1:
                # Black used for noise
                col = [0, 0, 0, 1]
    
            class_member_mask = (y_pred == k)
            xy = X_scaled[class_member_mask]
            plt.plot(xy[:, 0], xy[:, 1], 'o', markerfacecolor=tuple(col),
                     markeredgecolor='k', markersize=6, alpha=0.7,
                     label='Noise' if k == -1 else f'Cluster {k}')
    
        plt.title('DBSCAN Clustering')
        plt.xlabel('Feature 1')
        plt.ylabel('Feature 2')
        plt.legend()
    
        plt.tight_layout()
        # plt.show()
  • Hierarchical Clustering Example

    
    from sklearn.cluster import AgglomerativeClustering
    from scipy.cluster.hierarchy import dendrogram, linkage
    
    def hierarchical_clustering_example():
        # Generate synthetic data
        X, y_true = make_blobs(
            n_samples=50,     # Smaller sample size for clearer dendrogram
            n_features=2,
            centers=3,
            cluster_std=0.60,
            random_state=42
        )
    
        # Scale the data
        scaler = StandardScaler()
        X_scaled = scaler.fit_transform(X)
    
        # Initialize and fit Hierarchical Clustering
        hierarchical = AgglomerativeClustering(
            n_clusters=3,
            linkage='ward'    # Minimizes variance within clusters
        )
        y_pred = hierarchical.fit_predict(X_scaled)
    
        # Visualize results
        plt.figure(figsize=(15, 5))
    
        # Plot clustered data
        plt.subplot(1, 2, 1)
        plt.scatter(X_scaled[:, 0], X_scaled[:, 1], c=y_pred, cmap='viridis', alpha=0.7)
        plt.title('Hierarchical Clustering')
        plt.xlabel('Feature 1')
        plt.ylabel('Feature 2')
    
        # Create and plot dendrogram
        plt.subplot(1, 2, 2)
        linkage_matrix = linkage(X_scaled, method='ward')
        dendrogram(linkage_matrix)
        plt.title('Dendrogram')
        plt.xlabel('Sample Index')
        plt.ylabel('Distance')
    
        plt.tight_layout()
        # plt.show()
  • Gaussian Mixture Model Example

    
    from sklearn.mixture import GaussianMixture
    from matplotlib.patches import Ellipse
    
    def gmm_example():
        # Generate synthetic data with overlapping clusters
        X, y_true = make_blobs(
            n_samples=300,
            n_features=2,
            centers=3,
            cluster_std=1.0,
            random_state=42
        )
    
        # Initialize and fit GMM
        gmm = GaussianMixture(
            n_components=3,
            covariance_type='full',
            random_state=42
        )
        gmm.fit(X)
    
        # Get cluster assignments and probabilities
        y_pred = gmm.predict(X)
        probs = gmm.predict_proba(X)
    
        # Plot results
        plt.figure(figsize=(15, 5))
    
        # Plot cluster assignments
        plt.subplot(1, 3, 1)
        plt.scatter(X[:, 0], X[:, 1], c=y_pred, cmap='viridis', alpha=0.7)
        plt.title('GMM Clustering')
        plt.xlabel('Feature 1')
        plt.ylabel('Feature 2')
    
        # Plot probability contours
        plt.subplot(1, 3, 2)
        x, y = np.mgrid[-4:6:.01, -4:6:.01]
        pos = np.dstack((x, y))
        rv = gmm.score_samples(pos.reshape(-1, 2))
        plt.contourf(x, y, rv.reshape(x.shape), levels=20, cmap='viridis')
        plt.scatter(X[:, 0], X[:, 1], c='white', alpha=0.3)
        plt.title('Log Probability Density')
        plt.xlabel('Feature 1')
        plt.ylabel('Feature 2')
    
        # Plot cluster membership probabilities
        plt.subplot(1, 3, 3)
        for i in range(len(X)):
            plt.scatter(X[i, 0], X[i, 1], c=probs[i], cmap='viridis', alpha=0.7)
        plt.title('Cluster Membership Probabilities')
        plt.xlabel('Feature 1')
        plt.ylabel('Feature 2')
    
        plt.tight_layout()
        # plt.show()
    
    if __name__ == "__main__":
        print("Running Clustering Examples...")
        
        print("\n1. K-Means Clustering Example:")
        kmeans_example()
        
        print("\n2. DBSCAN Clustering Example:")
        dbscan_example()
        
        print("\n3. Hierarchical Clustering Example:")
        hierarchical_clustering_example()
        
        print("\n4. Gaussian Mixture Model Example:")
        gmm_example()

Interview Examples

K-Means vs DBSCAN

Compare K-Means and DBSCAN clustering algorithms. When would you use each?

Evaluating Clustering Quality

How do you evaluate the quality of clustering results without ground truth labels?

Practice Questions

1. How would you implement this in a production environment? Hard

Hint: Consider scalability and efficiency

2. What are the practical applications of Clustering? Medium

Hint: Consider both academic and industry use cases

3. Explain the core concepts of Clustering Easy

Hint: Think about the fundamental principles