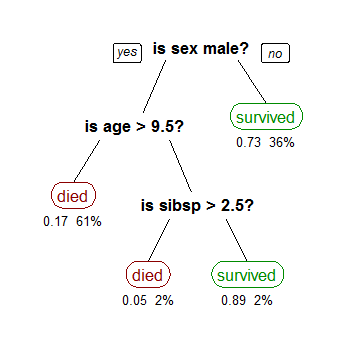
import numpy as np
import pandas as pd
from sklearn.tree import DecisionTreeClassifier, plot_tree
from sklearn.datasets import make_classification
from sklearn.model_selection import train_test_split
from sklearn.metrics import accuracy_score, classification_report
import matplotlib.pyplot as plt

def decision_tree_classification_example():
    # Generate synthetic classification dataset
    X, y = make_classification(
        n_samples=1000,
        n_features=4,
        n_informative=3,
        n_redundant=1,
        n_classes=3,
        random_state=42
    )

    # Split the data
    X_train, X_test, y_train, y_test = train_test_split(X, y, test_size=0.2, random_state=42)

    # Create and train the decision tree classifier
    clf = DecisionTreeClassifier(
        max_depth=4,              # Maximum depth of the tree
        min_samples_split=5,      # Minimum samples required to split a node
        min_samples_leaf=2,       # Minimum samples required at each leaf node
        random_state=42
    )
    clf.fit(X_train, y_train)

    # Make predictions
    y_pred = clf.predict(X_test)

    # Print performance metrics
    print("Classification Report:")
    print(classification_report(y_test, y_pred))
    print(f"Accuracy: {accuracy_score(y_test, y_pred):.4f}")

    # Visualize the decision tree
    plt.figure(figsize=(20,10))
    plot_tree(clf,
             feature_names=[f'Feature {i}' for i in range(X.shape[1])],
             class_names=[f'Class {i}' for i in range(3)],
             filled=True,
             rounded=True)
    plt.title("Decision Tree Visualization")
    # plt.show()

    # Feature importance analysis
    importances = clf.feature_importances_
    for i, importance in enumerate(importances):
        print(f"Feature {i} importance: {importance:.4f}")

    # Plot feature importances
    plt.figure(figsize=(10,5))
    plt.bar(range(len(importances)), importances)
    plt.title("Feature Importances")
    plt.xlabel("Feature Index")
    plt.ylabel("Importance")
    # plt.show()

def decision_tree_regression_example():
    # Generate synthetic regression dataset
    np.random.seed(42)
    X = np.sort(5 * np.random.rand(200, 1), axis=0)
    y = np.sin(X).ravel() + np.random.normal(0, 0.1, X.shape[0])

    # Split the data
    X_train, X_test, y_train, y_test = train_test_split(X, y, test_size=0.2, random_state=42)

    # Create and train the decision tree regressor
    from sklearn.tree import DecisionTreeRegressor
    regressor = DecisionTreeRegressor(
        max_depth=5,
        min_samples_split=5,
        min_samples_leaf=2,
        random_state=42
    )
    regressor.fit(X_train, y_train)

    # Make predictions
    y_pred = regressor.predict(X_test)

    # Calculate performance metrics
    from sklearn.metrics import mean_squared_error, r2_score
    mse = mean_squared_error(y_test, y_pred)
    r2 = r2_score(y_test, y_pred)
    print(f"\nRegression Metrics:")
    print(f"Mean Squared Error: {mse:.4f}")
    print(f"R² Score: {r2:.4f}")

    # Visualize the regression results
    plt.figure(figsize=(10,6))
    plt.scatter(X_test, y_test, color='blue', label='Actual')
    plt.scatter(X_test, y_pred, color='red', label='Predicted')
    plt.xlabel('X')
    plt.ylabel('y')
    plt.title('Decision Tree Regression Results')
    plt.legend()
    # plt.show()

def pruning_example():
    # Generate dataset
    X, y = make_classification(n_samples=1000, n_features=20, random_state=42)
    X_train, X_test, y_train, y_test = train_test_split(X, y, test_size=0.2, random_state=42)

    # Create a decision tree with different levels of pruning
    max_depths = [2, 4, 6, 8, 10, None]
    accuracies = []

    for depth in max_depths:
        clf = DecisionTreeClassifier(max_depth=depth, random_state=42)
        clf.fit(X_train, y_train)
        accuracy = accuracy_score(y_test, clf.predict(X_test))
        accuracies.append(accuracy)
        print(f"Max depth {depth}: Test accuracy = {accuracy:.4f}")

    # Plot accuracy vs tree depth
    plt.figure(figsize=(10,6))
    plt.plot(range(len(max_depths)), accuracies, marker='o')
    plt.xticks(range(len(max_depths)), [str(depth) if depth else 'None' for depth in max_depths])
    plt.xlabel('Max Depth')
    plt.ylabel('Test Accuracy')
    plt.title('Effect of Tree Depth on Accuracy')
    # plt.show()

    # Cost complexity pruning
    clf = DecisionTreeClassifier(random_state=42)
    path = clf.cost_complexity_pruning_path(X_train, y_train)
    ccp_alphas, impurities = path.ccp_alphas, path.impurities

    # Train trees with different values of ccp_alpha
    clfs = []
    for ccp_alpha in ccp_alphas:
        clf = DecisionTreeClassifier(random_state=42, ccp_alpha=ccp_alpha)
        clf.fit(X_train, y_train)
        clfs.append(clf)

    # Plot number of nodes vs ccp_alpha
    node_counts = [clf.tree_.node_count for clf in clfs]
    plt.figure(figsize=(10,6))
    plt.plot(ccp_alphas, node_counts, marker='o')
    plt.xlabel('ccp_alpha')
    plt.ylabel('Number of nodes')
    plt.title('Number of nodes vs ccp_alpha')
    # plt.show()

if __name__ == "__main__":
    print("Running Decision Tree Examples...")

    print("\n1. Classification Example:")
    decision_tree_classification_example()

    print("\n2. Regression Example:")
    decision_tree_regression_example()

    print("\n3. Pruning Example:")
    pruning_example()
