Svm

Overview

Support Vector Machine (SVM) is a powerful supervised learning algorithm used for both classification and regression tasks. SVMs are particularly effective in high-dimensional spaces and cases where the number of dimensions is greater than the number of samples.

Support Vector Machine

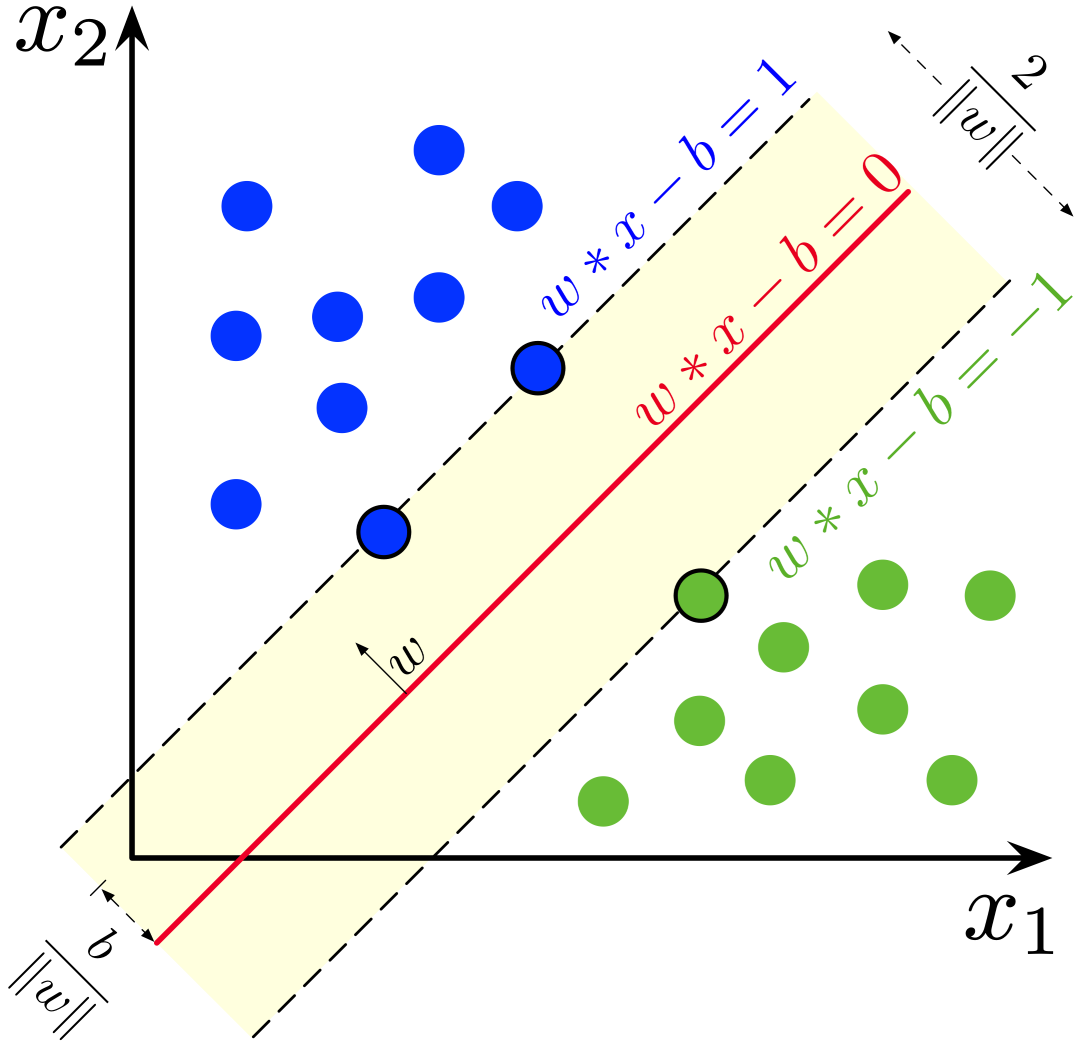
Support Vector Machine: Maximum margin hyperplane separating two classes with support vectors highlighted

Key concepts in SVM:

  • Hyperplane: The decision boundary that separates different classes
  • Support Vectors: Data points closest to the hyperplane that define the margin
  • Kernel Trick: Method to handle non-linear classification by mapping data to higher dimensions
  • Margin: Distance between the hyperplane and the nearest data point from either class

Core Concepts

  • Linear SVM

    Linear SVM works by finding the optimal hyperplane that separates different classes with the maximum margin. The mathematical formulation is:

    For a binary classification problem:

    • Find w, b that minimize: $\frac{1}{2}||w||^2$
    • Subject to: $y_i(w^T x_i + b) \geq 1$ for all i
    • Where:
      • w is the normal vector to the hyperplane
      • b is the bias term
      • x_i are the training examples
      • y_i are the class labels (±1)
  • Kernel SVM

    Kernel SVM extends the linear SVM to handle non-linear classification by mapping the data into a higher-dimensional feature space. Common kernel functions include:

    • Linear: $K(x_i, x_j) = x_i^T x_j$
    • Polynomial: $K(x_i, x_j) = (\gamma x_i^T x_j + r)^d$
    • RBF (Gaussian): $K(x_i, x_j) = \exp(-\gamma ||x_i - x_j||^2)$
    • Sigmoid: $K(x_i, x_j) = \tanh(\gamma x_i^T x_j + r)$
  • Key Parameters

    Important parameters in SVM:

    • C (Regularization):
      • Controls trade-off between margin maximization and error minimization
      • Larger C: Less regularization, tries to classify all points correctly
      • Smaller C: More regularization, allows for more misclassifications
    • kernel: Type of kernel function to use
    • gamma:
      • Kernel coefficient for RBF, polynomial and sigmoid kernels
      • Larger gamma: More complex decision boundary
      • Smaller gamma: Simpler decision boundary
    • degree: Degree of polynomial kernel function
    • coef0: Independent term in kernel function (used in polynomial and sigmoid)
  • Data Preprocessing

    Important preprocessing steps for SVM:

    • Feature Scaling:
      • Essential for SVM performance
      • Use StandardScaler or MinMaxScaler
      • Ensures all features contribute equally
    • Feature Selection:
      • Remove irrelevant features
      • Can improve training speed and accuracy
      • Consider dimensionality reduction
    • Handling Missing Values:
      • SVMs don't handle missing values natively
      • Use imputation techniques
      • Consider removing rows with missing values
  • Kernel Selection

    Guidelines for choosing the right kernel:

    • Linear Kernel:
      • Use when data is linearly separable
      • Good for high-dimensional data
      • Fastest to train and predict
    • RBF Kernel:
      • Good default choice for non-linear data
      • Works well when number of features is small
      • Requires tuning of C and gamma
    • Polynomial Kernel:
      • Use when data has clear polynomial relationship
      • More parameters to tune
      • Can be slower than RBF

Implementation

  • Linear SVM Classification Example

    
    import numpy as np
    import pandas as pd
    from sklearn import svm
    from sklearn.datasets import make_classification
    from sklearn.model_selection import train_test_split
    from sklearn.preprocessing import StandardScaler
    from sklearn.metrics import classification_report, confusion_matrix
    import matplotlib.pyplot as plt
    import seaborn as sns
    
    def linear_svm_example():
        # Generate synthetic dataset
        X, y = make_classification(
            n_samples=1000,
            n_features=2,
            n_redundant=0,
            n_informative=2,
            random_state=42,
            n_clusters_per_class=1
        )
    
        # Split the data
        X_train, X_test, y_train, y_test = train_test_split(X, y, test_size=0.2, random_state=42)
    
        # Scale features
        scaler = StandardScaler()
        X_train_scaled = scaler.fit_transform(X_train)
        X_test_scaled = scaler.transform(X_test)
    
        # Create and train linear SVM
        linear_svc = svm.SVC(
            kernel='linear',
            C=1.0,
            random_state=42
        )
        linear_svc.fit(X_train_scaled, y_train)
    
        # Make predictions
        y_pred = linear_svc.predict(X_test_scaled)
    
        # Print performance metrics
        print("Classification Report:")
        print(classification_report(y_test, y_pred))
    
        # Plot confusion matrix
        plt.figure(figsize=(8, 6))
        cm = confusion_matrix(y_test, y_pred)
        sns.heatmap(cm, annot=True, fmt='d', cmap='Blues')
        plt.title('Confusion Matrix')
        plt.xlabel('Predicted')
        plt.ylabel('Actual')
        # plt.show()
    
        # Visualize decision boundary (for 2D data)
        plt.figure(figsize=(10, 8))
        
        # Plot training data
        plt.scatter(X_train_scaled[y_train == 0, 0], X_train_scaled[y_train == 0, 1],
                    color='blue', marker='o', label='Class 0')
        plt.scatter(X_train_scaled[y_train == 1, 0], X_train_scaled[y_train == 1, 1],
                    color='red', marker='s', label='Class 1')
    
        # Create mesh grid
        x_min, x_max = X_train_scaled[:, 0].min() - 0.5, X_train_scaled[:, 0].max() + 0.5
        y_min, y_max = X_train_scaled[:, 1].min() - 0.5, X_train_scaled[:, 1].max() + 0.5
        xx, yy = np.meshgrid(np.arange(x_min, x_max, 0.02),
                            np.arange(y_min, y_max, 0.02))
    
        # Plot decision boundary
        Z = linear_svc.predict(np.c_[xx.ravel(), yy.ravel()])
        Z = Z.reshape(xx.shape)
        plt.contourf(xx, yy, Z, alpha=0.4)
    
        # Plot support vectors
        plt.scatter(linear_svc.support_vectors_[:, 0], linear_svc.support_vectors_[:, 1],
                    s=100, linewidth=1, facecolors='none', edgecolors='k',
                    label='Support Vectors')
    
        plt.xlabel('Feature 1')
        plt.ylabel('Feature 2')
        plt.title('Linear SVM Decision Boundary')
        plt.legend()
        # plt.show()
  • Non-linear SVM Example

    
    from sklearn.datasets import make_moons
    from sklearn.model_selection import GridSearchCV
    
    def nonlinear_svm_example():
        # Generate non-linear dataset
        X, y = make_moons(n_samples=1000, noise=0.15, random_state=42)
    
        # Split the data
        X_train, X_test, y_train, y_test = train_test_split(X, y, test_size=0.2, random_state=42)
    
        # Scale features
        scaler = StandardScaler()
        X_train_scaled = scaler.fit_transform(X_train)
        X_test_scaled = scaler.transform(X_test)
    
        # Create dictionary of SVMs with different kernels
        kernels = ['linear', 'poly', 'rbf', 'sigmoid']
        svm_classifiers = {
            kernel: svm.SVC(kernel=kernel, random_state=42)
            for kernel in kernels
        }
    
        # Train and evaluate each kernel
        plt.figure(figsize=(20, 5))
        for i, (kernel, classifier) in enumerate(svm_classifiers.items(), 1):
            # Train classifier
            classifier.fit(X_train_scaled, y_train)
            
            # Make predictions
            y_pred = classifier.predict(X_test_scaled)
            
            # Create subplot
            plt.subplot(1, 4, i)
            
            # Plot training data
            plt.scatter(X_train_scaled[y_train == 0, 0], X_train_scaled[y_train == 0, 1],
                       color='blue', marker='o', label='Class 0')
            plt.scatter(X_train_scaled[y_train == 1, 0], X_train_scaled[y_train == 1, 1],
                       color='red', marker='s', label='Class 1')
            
            # Create mesh grid
            x_min, x_max = X_train_scaled[:, 0].min() - 0.5, X_train_scaled[:, 0].max() + 0.5
            y_min, y_max = X_train_scaled[:, 1].min() - 0.5, X_train_scaled[:, 1].max() + 0.5
            xx, yy = np.meshgrid(np.arange(x_min, x_max, 0.02),
                                np.arange(y_min, y_max, 0.02))
            
            # Plot decision boundary
            Z = classifier.predict(np.c_[xx.ravel(), yy.ravel()])
            Z = Z.reshape(xx.shape)
            plt.contourf(xx, yy, Z, alpha=0.4)
            
            # Plot support vectors
            plt.scatter(classifier.support_vectors_[:, 0], classifier.support_vectors_[:, 1],
                       s=100, linewidth=1, facecolors='none', edgecolors='k',
                       label='Support Vectors')
            
            plt.title(f'{kernel.upper()} Kernel')
            plt.xlabel('Feature 1')
            plt.ylabel('Feature 2')
            if i == 1:
                plt.legend()
            
            print(f"\n{kernel.upper()} Kernel Performance:")
            print(classification_report(y_test, y_pred))
    
        plt.tight_layout()
        # plt.show()
    
    def hyperparameter_tuning_example():
        # Generate dataset
        X, y = make_classification(n_samples=1000, n_features=2, random_state=42)
        X_train, X_test, y_train, y_test = train_test_split(X, y, test_size=0.2, random_state=42)
    
        # Scale features
        scaler = StandardScaler()
        X_train_scaled = scaler.fit_transform(X_train)
        X_test_scaled = scaler.transform(X_test)
    
        # Define parameter grid
        param_grid = {
            'C': [0.1, 1, 10],
            'kernel': ['linear', 'rbf'],
            'gamma': ['scale', 'auto', 0.1, 1],
            'class_weight': [None, 'balanced']
        }
    
        # Create SVM classifier
        svc = svm.SVC(random_state=42)
    
        # Perform grid search
        grid_search = GridSearchCV(
            estimator=svc,
            param_grid=param_grid,
            cv=5,
            n_jobs=-1,
            scoring='accuracy'
        )
        grid_search.fit(X_train_scaled, y_train)
    
        # Print results
        print("Best parameters:", grid_search.best_params_)
        print("Best cross-validation score:", grid_search.best_score_)
    
        # Evaluate on test set
        best_model = grid_search.best_estimator_
        y_pred = best_model.predict(X_test_scaled)
        print("\nTest Set Performance:")
        print(classification_report(y_test, y_pred))
    
    if __name__ == "__main__":
        print("Running SVM Examples...")
        
        print("\n1. Linear SVM Example:")
        linear_svm_example()
        
        print("\n2. Non-linear SVM Example:")
        nonlinear_svm_example()
        
        print("\n3. Hyperparameter Tuning Example:")
        hyperparameter_tuning_example()
Interview Examples

SVM vs Logistic Regression

Compare Support Vector Machines with Logistic Regression. When would you use each?

Role of Kernels in SVM

Explain the kernel trick in SVM and when to use different kernels.

Practice Questions

1. How would you implement this in a production environment? Hard

Hint: Consider scalability and efficiency

2. What are the practical applications of Svm? Medium

Hint: Consider both academic and industry use cases

3. Explain the core concepts of Svm Easy

Hint: Think about the fundamental principles